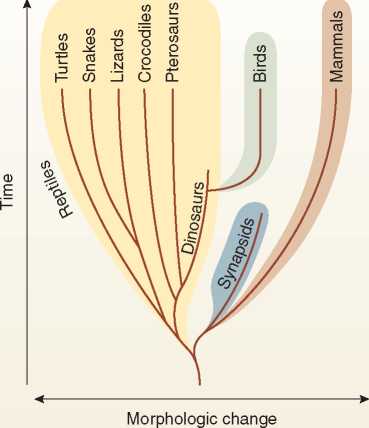
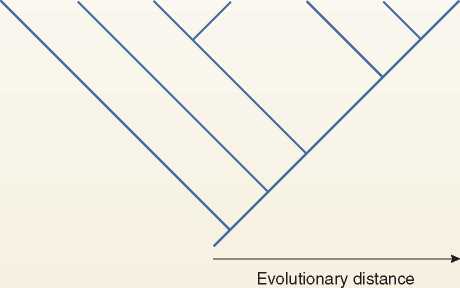
A branching diagram that illustrates a phylogenetic hypothesis.
Learning Objectives
Explain the meaning of a phylogenetic tree.
Understand how an evolutionary hypothesis is represented on a cladogram.
Summarize how phylogenetic patterns are reconstructed using cladistics.
Iologic evolution is chronicled in the genetic material and morphology of organisms. Genetic profiles can be “read” from the DNA or RNA sequences of modern organisms, but it is rare to find useful genetic material in strata older than the Holocene. In both fossil and modern organisms, evolutionary history can be reconstructed from morphologic evidence. Prime evidence of evolutionary, or phylogenetic, affinity is afforded by homologous structures (Figure 5.4A on page 129). Homologous structures not only allow us to reconstruct ancestor-descendant relationships among ancient organisms but also allow us to link ancient organisms to ones living today.
Once the evolutionary relationships within a set of organisms are understood, they can be depicted in various ways. Traditionally, relationships are depicted as a “tree” showing the branching of one species from another (Figure 5.1 4A). This method has drawbacks, including the necessity to redraft the inferred evolutionary pattern to accommodate new species or higher taxa that are discovered and inexactitude in testability. Another method of depiction is the cladogram, which is an evolutionary hypothesis illustrated with a simple branching stick diagram (Figure 5.1 4B).
Phylogenetic trees figure 5.14


A One way of illustrating a phylogenetic sequence is by using a tree showing ancestor-descendant relationships. This tree shows inferred relationships among some terrestrial vertebrate animals.
BAnother way of illustrating a phylogenetic hypothesis is by using a cladogram, which clusters taxa according to their degree of relatedness. Again, vertebrate animals serve as the example.
Synapomorphy
A shared derived character.
The core concept of a phylogenetic (or cladistic) analysis (Figure 5.15) is
That species or other taxa are grouped based on evidence of common ancestry. In other words, two taxa are shown to be closely related by virtue of a shared common ancestry.
A shared evolutionary history is evinced in derived characters, or modified versions of homologous characters. Derived characters, (or apomorphies, are of two types: synapomorphies (shared derived characters) and autapomorphies (unique derived


 World History


