The choice of sampling scheme is usually the most basic sampling decision to be made. At the same time, the choice is one of the most information-sensitive, methodological decisions of the entire research design process. The four basic, conventional kinds of schemes to choose from are ‘SRS’, cluster, stratified, and systematic sampling. The sampling scheme is the common way of referring to the sampling plan; archaeologists are frequently heard saying that they used ‘stratified sampling in the excavation of site XXX’ or that they useD ‘cluster sampling on the XXX survey project’. (In written reports, archaeologist’s complete description of the sampling plan includes the choice of (1) the sampling unit (that includes the size and shape of the unit) and (2) sample size, which is a slight misnomer because it refers to the number of sampling units chosen from the population. See the preceding section.) The choice of scheme should be determined by the amount off pre-investigational information available to, and used by, the research archaeologist. SRS should be used when little or no information about the target population is known, regardless of whether the target population is thought to be patterned or unpatterned. SRS crosscuts both patterning and nonpatterning in the target population and is commonly thought to the ‘safest’ and least challenging scheme that can be used, requiring the use of no existing information to create a sampling-based research design. The initial exploration and testing of sites about which no subsurface information exists is a good situation to use SRS. Overall, SRS results in a haphazard scatter of sampling units across a project area and may increase survey costs due to their possibly far-flung locations within the target population. Sampling units may be determined with the aid of a random number table or generator.
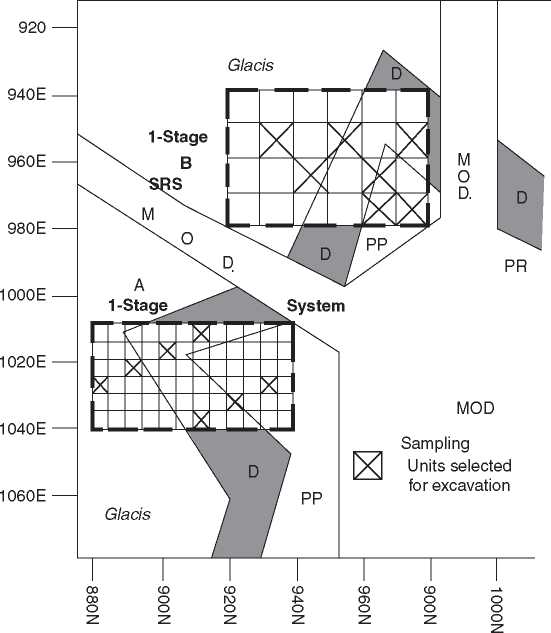
The cluster sampling scheme, as opposed to both the above SRS approach and the cluster sampling approach, is best used when moderate amounts of existing environmental or cultural information about the target population are known. The cluster sampling scheme subdivides the spatial population, the project area into arbitrary, grid-like areas that crosscut both obvious, known and hidden, undiscovered zones, for example, artifact-based cultural zones at the site level and environmental zones at the regional level (Figure 1 For clusters at the site level and Figure 4 And Table 1 For clusters at the regional level). The cluster sampling scheme is best used in two situations: (1) in sites or regions that are assumed, believed, or proven to be relatively homogeneous for any given cultural or environmental variable and (2) in sites or regions where arbitrary grids can be constructed so as to constitute a microcosm of the entire project area. Sites that contain only large, single-raw-material, artifact scatters and relatively few features, but without architectural residences, typically qualify for the cluster sampling scheme. Each cluster is a replica of other clusters in the project area (see Figure 1 Where each of the four rectangular clusters contain portions of the three exca-vatable portions of the fort - the glacis, ditch, and parapets-parade), and the variability/diversity of the target population is minimal. The cluster sampling scheme results in a tightly clustered distribution of sampling units that frequently makes fieldwork easier and reduces its costs.
The single-stage cluster sampling scheme is plotted on the fort site plan (Figure 1, left) with selected sampling units shown in the detail of Figure 5. Single stage refers to the fact that primary clusters are

Figure 5 Site-level, single-stage, intra-cluster sampling at Gridley’s fort. Top: The ‘B’ primary cluster was divided in a single stage to 10 X 10ft sampling units which were selected by SRS, producing a less-patterned arrangement of selected sampling units than systematic below. Bottom: The ‘A’ primary cluster was divided in a single stage to 5x5 ft sampling units. The bias-creating patterning characteristic of systematic sampling is shown by the linear, diagonal arrangement of selected sampling units (see Figure 1 For legend).
Divided only once and then directly into sampling units; there are no intervening divisions between the primary cluster and the sampling unit. In Figure 5, ‘A’, the reader can count the small, solid-line squares to see that the frame consists of 72-5 x 5 ft sampling units (that are called test or excavation units in nonsampling archaeological parlance). The units that would be excavated were selected by systematic sampling (see below in this same section) within the primary cluster. In Figure 5 ‘B’, the reader can also count the solid-line squares to see that the frame consists of 24-10 x10ft sampling units (that are called test or excavation units in nonsampling archaeological parlance). The units that would be excavated were selected by simple random sampling (SRS, see above in this same section) within the primary cluster. Both examples in Figure 5 Illustrate a 10% sample fraction ‘within the cluster’. However, the overall ‘site sampling fraction’ would have been a minuscule 0.4% for ‘A’ and 1.4% for ‘B’. Hardly any archaeologist would be satisfied with that and, hence, additional primary clusters can be laid out and the above procedure repeated.
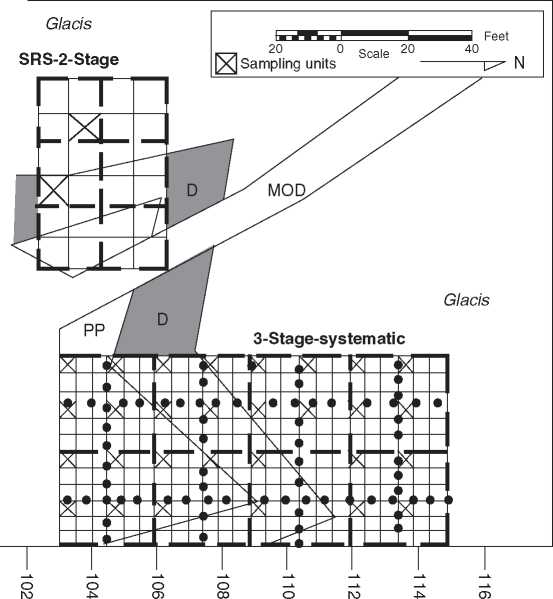
Multistage cluster sampling schemes are variants of single-stage cluster sampling and involve several divisions of the primary cluster. In the two-stage cluster sampling of Figure 6, top, the primary cluster is spatially subdivided twice - first into six subclusters (the heavy dashed lines) and then the subclusters are each divided into four sampling units (the light, solid lines). This process resulted in a frame of 24 sampling units in the sampled population. Within ‘each subcluster’, consisting of four 10 x 10 ft sampling units, a single sampling unit could have been randomly selected for excavation. This process would have produced a 25% sampling fraction which differs, for illustrative purposes, from the 10% sampling fraction of single-stage cluster sampling (Figure 5). To reduce the 25% sampling fraction of the two-stage cluster sample (Figure 6, top) the following process was used - as a standard process of randomly deleting subclusters to attain the exact sample size/ fraction desired: 1-number the subclusters 1-6, as shown; 2-from a random number table, randomly draw single digits between 1 and 6; 3-the first two such digits would represent the two subclusters

Figures Site-level, multistage sampling within clusters at Gridley’sfort. Top, two-stage: Six subclusters were laid out on paper and only two were randomly selected for choosing sampling units in order to reach a 10% sample size/fraction within the primary cluster. Bottom, three-stage: The primary cluster was divided three times into subcluster, sub-subcluster, and sampling units which were selected by the systematic method, producing two-way linear patterns of the sampling units.
From which a 10 x 10 ft sampling unit would be selected for excavation. These two units, out of the 24 in the frame/sampled population, result in a 1/12th intra-primary cluster sampling fraction, close to the intra-primary cluster 10% of the single-stage example of Figure 5. The point is that the elimination of subclusters has to be done randomly to qualify the sampling procedure as probablilistic. Another point shown is the difficulty of exactly attaining a specified sampling fraction with large (10 x 10 ft) sampling units.
Figure 6, bottom, illustrates three-stage cluster sampling with 5x5 ft sampling units. The multistage sampling procedure begins with locating and outlining the primary cluster, which is then spatially subdivided three times - first, into eight subclusters (the bold, dashed lines) and, secondly, the subclusters are each divided into four sub-sub-clusters (the bold, dotted lines) which, thirdly, are then each subdivided into nine sampling units (the light, solid lines). Thus, this process would have resulted in 288 sampling units. Within ‘each sub-sub-cluster’, consisting of nine 5 x 5 ft sampling units, a single sampling unit was systematically selected for excavation - systematic because it was the same numbered sampling unit in each sub-sub-cluster. In this case, the first sampling unit would be excavated because the digit ‘1’ was selected randomly from among the eligible digits of one to nine. This process produced an 11% intra-primary cluster sampling fraction (1/9th), close to the illustrative standard of 10%. However, the overall site sampling fraction would have been a minuscule 0.4% for two-stage and 1.5% for three-stage. Hardly any archaeologist would be satisfied with that and, hence, additional primary clusters can be laid out and the above procedure repeated.
Also, the lesson to be learned is that, with smaller sampling units and another stage of dividing the primary clusters, it is easier to reach a desired sampling fraction.
Requiring the maximum amount of pre-investigational information, stratified sampling subdivides the spatial population, the project area into real, nonarbitrary areas, such as architecture residence zones, trash areas, burial loci, catchment areas, microniches, and vegetative zones. A large project area to be surveyed is generally stratified on the basis of contemporary environment, but stratifying on the basis of prehistoric environment would be better (but it

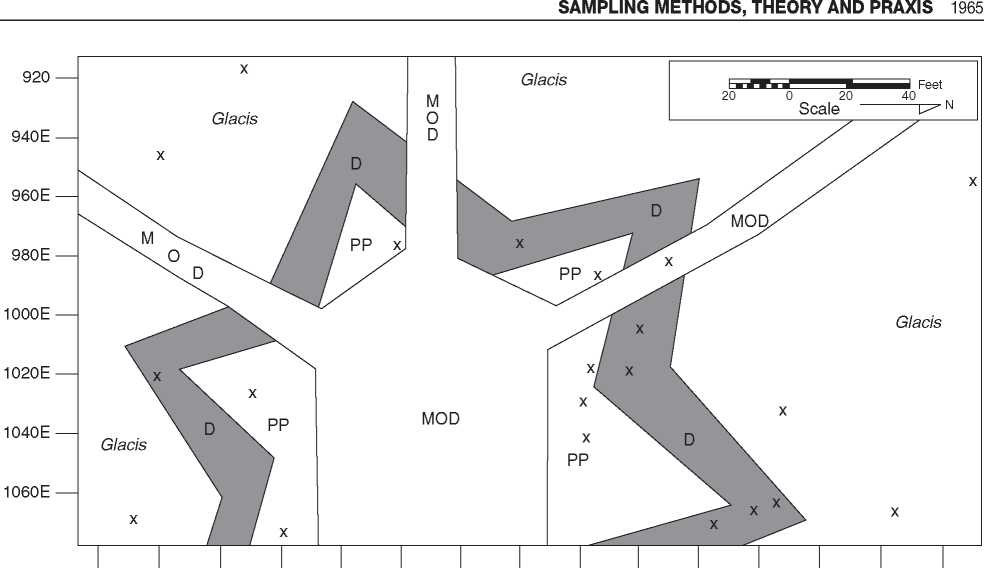
Figure 7 Site-level, stratified sampling, disproportional, scheme at Gridley’s fort. Seven sampling units were selected by SRS from each of the unequal sized strata, producing strata-specific, sample fractions that were also unequal - this is what is meant by ‘disproportional’. Although randomly selected, many selected sampling units turned out to concentrated in the ditch and parade-parapet on the fort’s north side (PP, the fort’s parade-parapet area; the fort’s ditch; MOD, modern paved walkway; x, 5 x 5 ft sampling units (21) selected for excavations).
Requires a lot of known, prehistoric environmental data). At the site level, a prehistoric excavation project may subdivide the site into artifact concentrations of various raw material types. A prehistoric site that has been tested may be found to contain spatially discrete subdivisions such as a trash scatter, an artifact scatter, a burial area, a feature area for outdoor food processing/preparation, and an area of architectural residential units. Each of these spatially discrete areas constitutes a stratum and can be excavated in greater depth through the use stratified sampling. At Col. Gridley’s historic fort site, the strata (Figure 7) are the parts of the fort - ditch, glacis, and parapets-parade.
Stratified sampling emphasizes internal distinctions within the project area, and each strata should be as different as possible from other strata. Stratified sampling is best used when variability within the target population, within the project area, is maximum. With stratified sampling, boundary problems become significant because the sampling units are generally grids while cultural phenomenon are not geometric. The distribution of sampling units in stratified sampling across a project area is fairly haphazard, similar to SRS. Stratified sampling can be combined with SRS (as was done in Figure 7) as a means of selection within strata; the unaligned technique can also be combined with stratified sampling to randomize the selection process within. By comparison, the basis for the cluster sampling scheme is more arbitrary, intuitive, and impressionistic, while stratified sampling tends to be more data based, easier to describe, and more verifiable.
Figure 7 illustrates the stratified, SRS, dispropor-tional scheme, so named because the sampling fraction in each stratum is disproportional, that is, the stratum sampling fractions are unequal. This happens because the surface area of each stratum is different and the author selected seven 5 x 5 ft sampling units in each stratum, resulting in unequal sampling fractions. Overall, the site sampling fraction would have been a minuscule 1.06%. Proportional (read ‘equal’) sampling is the other major kind of stratified sampling. For illustration, proportional sampling could be attained in this fort case by making the number of selected sampling units proportional to the area of each stratum.
The choice of sampling scheme is also related to anthropological-like assumptions about human behavior and the archaeological record. If one assumes, believes, or has proven, for the immediate project area, that the archaeological record and the human behavior that produced it are primarily random and unpatterned (as, perhaps, during the past ascendancy of chaos theory), then any of the above schemes can be used indiscriminately with no preference for one scheme over another. This may have been a popular approach consistent with the intuitive sampling generally employed during the preprocessual days of the 1950s and earlier.
Systematic sampling is frequently used in survey level projects because of mechanical convenience; sampling units (shovel tests, collection grids, and walkover units) can be easily selected on a regular basis. If, however, the research archaeologist assumes, believes, or has proven, for the immediate project area, that the archaeological record is primarily nonrandom and patterned, then systematic sampling should not be employed by itself or in consort with any of the three other basic types of schemes. This is because systematic sampling selects sampling units in a patterned way; the patterning or interval in the sampling units on the frame may select all of a certain kind of cultural item in the archaeological record or may select none of a certain kind of cultural item in the archaeological record. Systematic sampling has these inherent, hidden conceptual risks that usually are ignored because of its mechanical convenience. Because of this hidden disadvantage, systematic sampling is considered almost as a nonprobabilistic technique, somewhere between judgment sampling and SRS. The systematic interval between sampling units is determined by dividing the number of sampling units on the frame by the sampling fraction, and the quotient is the upper limit of the starting point the first sampling unit selected (one is, perforce, always the lower limit!). The unaligned technique can be used, instead of the systematic scheme, in combination with stratified sampling to randomize the selection process within strata, avoiding the patterning disadvantage of systematic sampling. This inherent bias in systematic sampling can be corrected by a statistical treatment known as post-hoc analysis.


 World History


