Nondestructive and (Other) Microdestructive Techniques
The principles of X-ray fluorescence spectrometry (XRF) form the basis for microanalysis in the context of electron probe microanalysis and spectrometers attached to scanning electron microscopes. The principles of XRF therefore will described first.
XRF analysis can be a totally nondestructive technique. It is a surface technique of spectroscopic analysis which relies on the interaction of primary X-rays with the sample generating, among other particles, a range of secondary X-rays which have energies characteristic of each of the elements in the sample. It produces a spectrum of energies in the same way that AES does. The primary energy source can either be a radioactive material which will generate g-rays; when fired at the sample in a solid geometry, the interaction of the g-rays with the sample will generate secondary X-rays. A much more common source of X-rays is an X-ray tube which, when configured within a commercially produced system, will be located in a stable position, allowing the same analytical geometry to be repeated each time (the same analytical geometry is important if quantitative analysis is attempted).
The primary X-rays interact with each of the elements in the sample surface. During this process, secondary X-rays are emitted at the takeoff angle, escaping from the sample at the same angle at which the primary X-rays were fired at the sample. A variety of energy transitions occur between inner atomic electron shells in each atom, and these lead to the generation of the secondary X-rays. The secondary X-rays hit a detector (typically silicon drifted with lithium) with an analog-to-Digital converter attached to it. Conversion of discrete pulses of secondary X-ray energies into electrical pulses occurs depending on the atomic weight of the element concerned. The electron pulses are then fed into a multi-channel analyzer which displays the maxima in the spectrum of X-ray energies as a series of peaks above the background (see Figure 1 For an X-ray spectrum). The peaks are a Gaussian shape because the process by which the peaks are formed is one dependent on counting probability, whereby the maximum number of events which fall at the exact center of the peak produce the maximum peak height. The ‘tails’ of the peak are due to a smaller number of events at energies above and below the peak centroid.
The depth to which the primary X-rays penetrate the sample is mainly dependent on the energy of the primary X-rays, the angle at which the X-rays are fired at the sample, and the matrix composition of the sample. With a material which contains a relatively high proportion of a heavy element, like lead, with an atomic number of 82, secondary X-rays for a relatively light element, like potassium, also in the material, will be derived from a shallower maximum depth than a material which on average has a lighter matrix. The greatest depth from which elemental X-rays are derived is therefore an important consideration because it partly determines the sensitivity of each element to X-rays and therefore the number of X-ray photons that are detected per unit time. If the count rate is low, the length of the count time in order to produce acceptable statistics needs to be increased.
There are two principal types of XRF: energy-dispersive and wavelength-dispersive spectrometry. Energy-dispersive spectrometry operates by collecting data from the detector, distinguishing it according to its energy and displaying it in spectral form. Wavelength-dispersive spectrometry, on the other hand, relies on a different means of operation. In this case, the spectrometer relies on the presence of crystals causing the secondary X-rays to be diffracted at a particular angle, according to its atomic number.
File Operation
231.A2l 34<I.6S) |P»sst lUem Clear Iftperture # 6
0 cut (ROIt 0)
DT 32% Cursor 0.09 KeV =
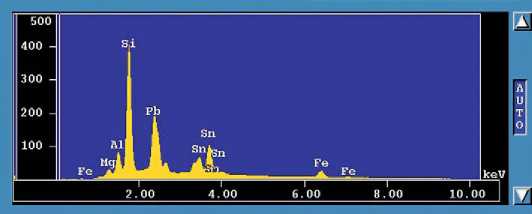
Figure 1 An X-ray spectrum of an opaque yellow lead-silica glass which is opacified with lead-tin oxide. The X-axis displays the relative number of counts for each element detected above the background. The Y-axis displays the X-ray emission energies for each of the elements. Note that some elements are more sensitive to X-rays than others so the relative peak heights are not a reflection of the relative quantities of each. Tin (Sn) and iron (Fe) have a number of X-ray peaks. These result from the interaction of electrons (in this case) with different orbitals in the atoms. (Source: author.)
The secondary X-rays are detected electronically. The dispersion of the secondary X-ray is greater than with energy-dispersive X-ray spectrometry which makes it possible to separate the X-rays peaks more completely and, in general, also makes it possible to detect elements at lower levels. Wavelength-dispersive spectrometry is normally slower simply because the spectrometer angle needs to be changed, and from time to time also the crystals in the spectrometer, depending on what elements are sought.
Typically wavelength-dispersive X-ray spectrometry is used to analyze material that has been powdered and made into a silicon borate glass bead. The bead is cast so that it lower surface is flat and of the appropriate diameter for the beam of primary X-rays used for its analysis. Energy-dispersive spectrometry, on the other hand, can more readily be used as a totally nondestructive technique and is therefore more appropriate to a museum environment. HowEver, if the sample has an irregular surface and/or is weathered/or depleted in any way, it is difficult to produce a quantitative result. The obvious use for energy dispersive (ED) analysis in a museum is to provide an initial identification of a material, though it must never be forgotten that the technique only provides an analysis of the surface. The depth to which the exciting energy (X-ray or g-ray) penetrates the sample is dependent on, in the case of an X-ray tube, the voltage used and also the matrix composition of the material: for a ‘light’ matrix the depth from which the heaviest secondary X-ray may escape to be detected is c. 40 pm, whereas for the analysis of materials with ‘heavy’ matrices the maximum depth is more typically 15 pm.
The successful quantification of the results from XRF depends on a number of factors. An ideal sample is one which is polished flat and compositionally homogeneous. The factors which affect the analysis include X-ray tube voltage, the composition of the anode which is used in the X-ray tube, the geometry of the analytical system, the use of a collimator, the roughness of the sample surface, the extent of interference between elements in the X-ray spectrum, whether the X-ray emission peaks are successfully deconvoluted, and the composition of the sample being analyzed (a greater ‘absorption’ of light elements, such as sodium or magnesium occurs in a matrix which consists of a heavier average Z (atomic number). In addition, the use of a reliable set of standards of known composition is absolutely essential, as it is for almost any analytical technique. Obtaining a ‘reliable’ set of standards can be difficult and is one way of checking the quality of the analyses. Finally, the kind of quantification program employed can affect the results. In the case of XRF, the use of fundamental parameters or the influence coefficients can be used.
Electron Probe Microanalysis
A microdestructive technique which produces high-quality results is electron microprobe analysis. This followed on from the milliprobe and its early use in analysis, becoming commonly used, especially for research in mineral sciences, in the 1970s. As the technique suggests, microsamples as small as 0.5 mm can be mounted and analyzed. The technique involves the use of a microbeam of electrons which are focused on the sample surface using a series of magnetic lenses. The electrons themselves are generated using an electron gun (in Figure 2). The interaction of the electrons with the sample generates secondary X-rays which are characteristic to the chemical elements in the material.
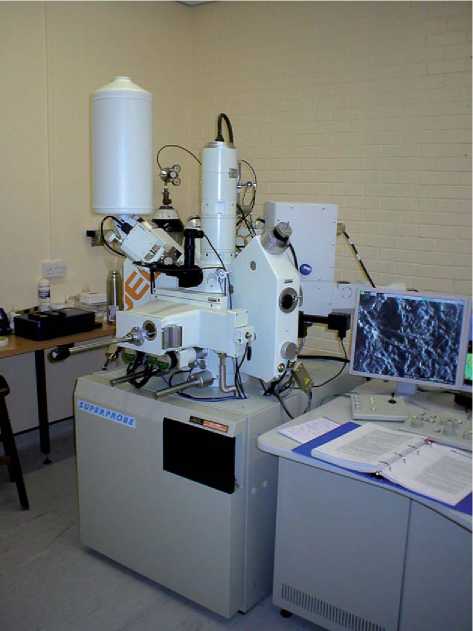
Figure 2 A Jeol JSM 8200 electron microprobe in the Department of Archaeology, University of Nottingham. An energy-dispersive spectrometer is located on the left-hand side of the machine, the electron gun in the center (mounted vertically) and one of four wavelength-dispersive spectrometers is on the right-hand side of the machine with a cathodoluminescence facility mounted behind it. In this case the samples can be imaged in both secondary - and backscattered electron modes. The screen shows a secondary-electron image. Samples are located beneath the electron gun. (Source: courtesy of Edward Faber.)
I London raw AAmsterdam raw ¦Venice cristallo
I London others Amsterdam others ¦Venice vitrum blancum
This technique provides an analysis of a shallower layer of material than with XRF (-3-5 pm compared to c. 30-50 pm), and by sampling and preparing the sample carefully the quality of the results when compared to open geometry ED X-ray analysis is far higher. The samples are normally embedded in epoxy resin and polished flat so that the geometry of the analysis is repeated exactly each time. In the process of doing this, any weathered material can be removed.
The electron beam can be focused or defocused depending on the intended area of analysis; it may also be essential to defocus the beam in order to minimize or eradicate the possibility of volatalizing the sample surface, causing elements like sodium to be boiled off. In practice, the minimum diameter of a focused electron beam during the analysis of a metal or even a ceramic is 1 pm on the sample surface, which spreads out in the metal itself to c. 2 pm; for glass, the beam needs to be deliberately defocused to c. 50-80 pm.
The electron probe was introduced in c. 1975 primarily as a tool used by geologists. As a result, some of the early models used were ideal for the analysis of silicates, part of which to analyze chemically individual crystals in ceramic materials. Apart from being microdestructive, one of the other advantages of the technique is that it is possible to locate the electron beam precisely on the area of the sample to be analyzed with the use of a microscope attached to the system; if compositional heterogeneity is suspected, an energy-dispersive detector attached to the system can be used to carry out qualitative point analyses before the quantitative analyses are performed. A scanner attached to the machine can also provide an image of the sample. It would be possible to quantify the ED results from the system but the levels of precision and detection achieved with the wavelength dispersive probe are of a far higher quality. This same comparison is also true when the results from an ED spectrometer attached to a scanning electron microscope and those from a wavelength-dispersive system in an electron microprobe are compared.
The technique is a quantitative one, and given the small beam size it is normal to analyze three to five spots of a homogeneous material like glass, and average the results. The system must be calibrated before chemical analysis is attempted with the use of standards, preferably of the material being analyzed for the major elements, so as to reproduce the matrix conditions of differential absorption of secondary X-rays. Geological standards may be used for pure elements occurring at minor or trace levels in the unknown. As with any analytical technique, the cross-analysis of a multielement standard not used in calibrating the system and of proven reliability at the start and end
6.00 8.00 10.00 12.00 14.00 16.00 18.00 20.00
Weight % soda (Na2O)
Figure 3 The relative levels of sodium and potassium oxides in late sixteenth and seventeenth century raw and vessel glasses from factory and other sites in London, Amsterdam and Venice showing distinctions in the chemical compositions of glasses from each zone. Note that three samples of raw glass from Amsterdam fit with the compositions of vitrum blancum glass from Venice and were therefore imported from Venice.
Of the analysis will provide two things: the determination of relative analytical accuracy and a means of monitoring any drift in the system. EPMA can be used to distinguish between different production zones (see Figure 3).
Scanning Electron Microscopy
As mentioned above, scanning electron microscopy (SEM) can be used for microanalysis, and it is possible to attach both energy-dispersive and wavelength-dispersive spectrometers to the instrument, but the quality of the analyses will not be as high as for a dedicated electron microprobe because in the context of an SEM it is not possible to reproduce the same analytical geometry as for a microprobe. Indeed, the systems should not be confused - they are different and should be referred to as an electron microprobe and an analytical SEM, respectively.
The SEM is primarily used for imaging structurally or compositionally heterogeneous organic and inorganic materials. The systems are often fitted with an energy-dispersive spectrometer, a secondary electron detector, and a backscattered electron detector (see Figure 4). The secondary electron detector provides images of the surface texture of materials, whereas the use if a back-scattered detector mainly provides images of variations in composition. Such detectors can also be attached to the EPMA.
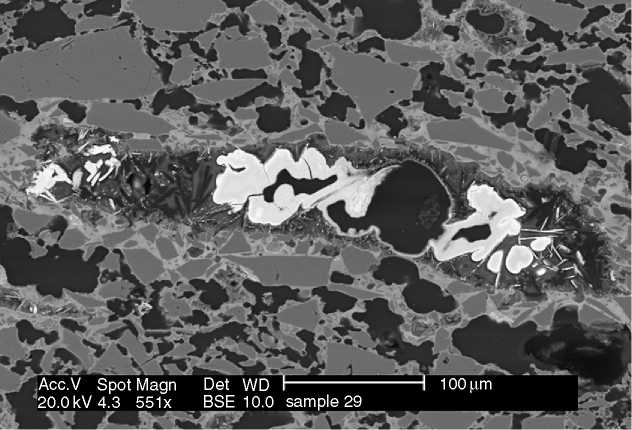
Figure 4 A backscattered electron micrograph of a thick section of Ottoman ceramics. The image is formed from contrasting grey levels which are dependant on the variations of average Z (atomic number) in each component. The grey angular grains are silica, the white material in the middle is calcium phosphate (bone ash) and the pale grey matrix materials that surrounds many of the silica crystals is a soda-rich glass. (Source: courtesy of Martin Roe.)
The source of energy for an SEM is an electron gun. Instead of the electrons being focused as a point as in the electron microprobe they are focused in a particular plane, but also scanned across the material using scanning coils so as to build up an image of their interaction with the material. Because backscat-tered electrons travel in almost straight lines and the detector is located to one side of a specimen, a shadowing effect is produced. A secondary-electron image is dependent on the angle between the beam and the specimen surface (see Figure 1). Differences in gray level are, as a result, a reflection of the angle of the surface to the detector: the roughness of the surface and the shape of the sample can be seen clearly in this image of the surface of glass, including characteristic conchoidal fractures. Backscattered electron images, on the other hand, provide pictures of compositional heterogeneity by recording the number of backscattered electrons from the sample, a measure of the relative average atomic number in the area being analyzed. The secondary electron images therefore provide highly magnified images of the surface textures of materials, whereas backscattered electron images are built up from variations in composition. The two techniques can of course be also used in conjunction with each other: if a small area of decoration has been applied to a metal surface which is of a different composition from the body of the artefact, the SEM may provide evidence for both the way in which the decoration has been attached and also how the materials used are different.
Whereas with an electron microprobe an initial examination of a thin section of a pottery sample can provide an unambiguous identification of the crystal, which can then be pinpointed and analyzed chemically by using a photograph, the SEM can provide clear images of how a particular compositional family of crystals (e. g., alkaline feldspars) might vary in composition and texture within the same sample or between samples from different sources. In addition, of course, the SEM can be used to show great compositional contrasts between crystals and the matrix material they are sitting in, between layered materials and between depleted/ corroded surfaces and the parent material. By examining cross-sections through materials, it is possible to relate structural corrosion to changes in chemical composition which can, in turn, be recorded photographically.
For successful imaging using a backscattered detector, it is appropriate to use a sample that has been mounted and polished flat in the same way as the sample was prepared using the electron microprobe. This procedure is of course inappropriate if the sample is being examined for its surface texture, in which case it should be carefully attached to a stub within the SEM and can be rotated to examine different areas of interest.
In order to examine materials like metals which conduct electrons, the sample can be attached to the stub within the system. If the material is glass, glaze, or obsidian, for example, and does not conduct electrons, then it needs to be coated so as to prevent distortion and deflection of the electron beam; this is also true for electron microprobe analysis. The sample size that can be examined under the SEM is determined by the size of the sample chamber. Since samples are examined under vacuum, open geometry is not possible, as it can be with XRF spectrometry. A range of SEM systems are manufactured and relatively large objects can be accommodated, of up to c. 5 cm X 3 cm in dimensions.
Particle-Induced X-Ray Emission
The feature that characterizes particle-induced X-ray emission (PIXE) is the cost and size of the instrument! The analytical technique requires a tandem van der Graaf accelerator in order to generate particles which are accelerated at high speeds toward the sample where they collide and penetrate the sample at great speeds. A particle accelerator can cost up to ?500 000. The same size of sample prepared in the same way as for the SEM and electron probe microanalysis (EPMA) can be used and is presented to the beam in a fixed geometry. The system can be operated in both an open geometry and in a sample chamber, so the sample size can, theoretically, be infinite. With an open geometry system, it is also possible to analyze materials containing light elements by bathing the sample in helium so as to prevent the light secondary X-rays produced from being absorbed in the air before being detected.
Analytically, the most significant difference from EPMA is that the backgrounds produced by PIXE are a factor of 10 lower (see Figure 5). The reason for this is that the particles bombarding the sample enter the sample at such a great speed that less scattering of the particles occurs than when electrons or X-rays are used as the primary exciting energy. The net result is that the background of the X-ray spectrum is significantly lower, allowing far lower concentration of components to be detected. Some PIXE systems are fitted with scanning coils so that the distribution of elements through the surface of the material can be mapped, including at very low concentrations. The same detector system and multichannel analyzer is often used as for EPMA and SEM systems, a lithium-drifted silicon detector.
The depth of analysis for PIXE is in the same magnitude of order as for stand-alone ED-XRF analysis, but also, as with XRF, is dependent on the voltage that the system is operated at, which in the case of PIXE is typically 1.5 or 2 MeV. The depth of penetration by the analyzing beam can be up to 50 pm in a material with a light matrix and only c. 15 pm in a heavy matrix. If the substance being analyzed contains crystals which are 10 pm below the surface there is no way, at present, of separating the contribution made by the crystal to the analysis from that made by the matrix of the material. SEM and EPMA systems are more appropriate analytical techniques in the analysis of crystalline materials.
In addition to being able to detect elements at very low concentrations, by using PIXE it is also possible to map elemental distributions through the thickness of a sample by analyzing its surface This technique is known as Rutherford backscattering and relies on backscattering of the protons from crystallites or other particles within the sample being analyzed.
X-ray Diffraction Spectrometry
This technique can be used to identify unambiguously the type of crystals present in minerals, stone, metals, pottery, opaque glasses, opaque enamels, and opaque glazes, or it can be used to assess the degree of
Field of view: 78 X 78 pm2
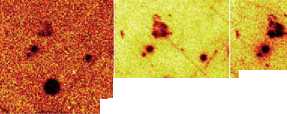
Mg (26) Al (126) Si (77)

Fe/CaO (40) Sb isotopes (?) Pb isotopes (167) PbSbO2 (77)
Figure 5 A series of compositional maps produced from time-of-flight secondary ion mass spectrometry. Each image is for different ions in the same sample of opaque turquoise glass. This is similar to those produced using a scanning-electron microscope. However the levels of detection can be an order to 100-1000 lower. The opacity is due to the presence of calcium antimonate crystals. By using this technique, however, it can be seen that iron and lithium impurities are co-located in the crystals. No other technique has such a shallow depth of penetration combined with great analytical sensitivity (especially for light elements) combined with high special resolution.
Crystalinity in a material. It is destructive in that an object must be sampled, but the sample can be small and it is not destroyed in the same way that it is with truly destructive techniques. The technique involves firing radiation of a particular wavelength (monochromatic) at the crystalline material which is mounted at a specific angle to the incoming energy. The interaction of the radiation with the crystal(s) produces an X-ray pattern which is characteristic of the structure of the crystal. Crystals are composed of lattices built up in a regular pattern; their size and spacing is characteristic of the crystal species. The technique produces spectra which sometimes include several peaks for a single crystal providing the crystal identity. Thus, while it is possible to determine the chemical composition of calcium antimonate, for example, it is only with XRD that it is possible to distinguish between Ca2Sb2O7 and Ca2Sb2O6. In some cases, different species of crystals are formed at different temperatures, so XRD can help to determine what temperature regimes were involved in the production process. For example, a-quartz is the normal form of silica which occurs in nature. When it is heated to 573 ± 5 °C it is converted to b-quartz. At 867°C, b-quartz is converted into another form of silica, tridymite; at 1250 °C, cristoba-lite is formed. These reactions can be slow, a feature which may be of interest to the archaeological scientist, because it shows that the material was held at the temperature before the transformations occurred. In any case, since all three crystal types have the same chemical composition (silica), only by using XRD is it possible to identify the species involved.
The original XRD camera was used to take photographs of patterns produced by d-spacings in one or more crystal samples in the material analysed. More recent developments incorporating fully automated equipment has involved a thin slurry of the material deposited on a slide. The resulting radiation is measured and the spectra fed electronically into a computer which has a library of d-spacings making it possible to match the unknown pattern to those stored in the computer. Quantitative assessments of the relative proportions of different crystal species in the sample are possible by examining the relative intensities of the peak heights. This needs to be carried out on several subsamples of the material being analyzed to produce a representative picture. Thin-section petrology is a more effective means of carrying out such quantitative work.


 World History


