Site mapping methods today are changing rapidly with developments in survey technology and falling costs, leading to the widespread use of GPS and Total Stations (theodolites with electronic distance measurement and digital data logging).
Differential GPS (DGPS), with a normal accuracy in the range 0.5-1 m, provides an effective solution for mapping larger sites, laying out grids or determining ground control points to allow integration of airborne sensor and satellite imagery, oblique aerial photographs and historical maps into a site GIS. Total Stations, with centimeter accuracy, come into their own for precision surveying and detailed site mapping over small areas (Figure 15), or where GPS cannot be used (caves, rockshelters, forest canopy, steep valleys, and urban canyons block the GPS satellite signals).
Accuracy and Precision
In setting up to map a site, the archaeologist must choose appropriate techniques which reflect the type of site to be mapped and the aims of the mapping. These include a consideration of scales of recording appropriate to the questions being asked and the appropriate levels of accuracy and precision required.
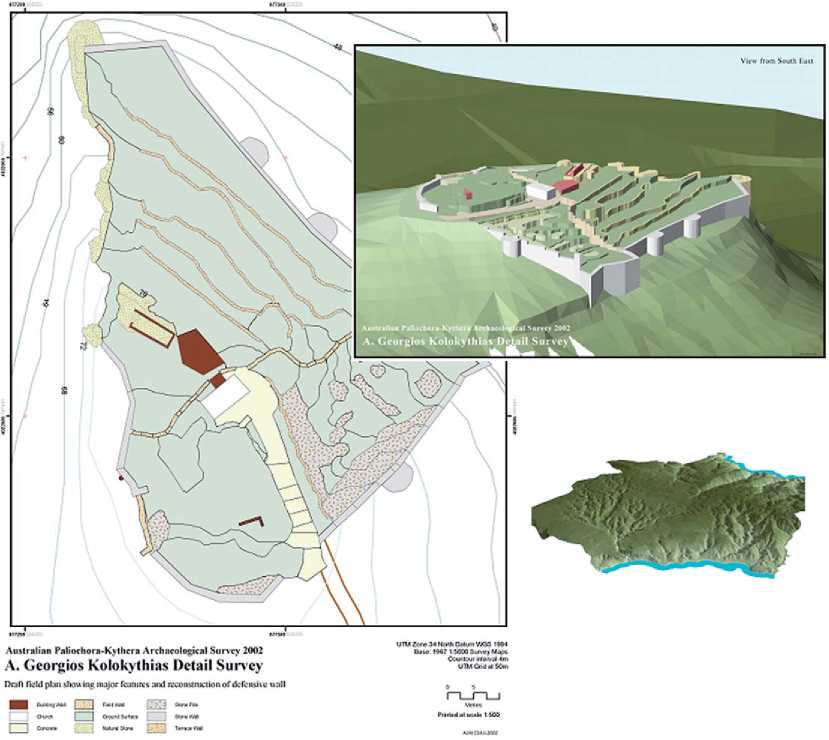
Figure 13 Byzantine fortification, Agios Georgios Kolokythias, Kythera, rendered as a plan and as a three dimensional visualization through extrusion of mapped features. The plan and visualization were created during fieldwork using GPS and GIS software.
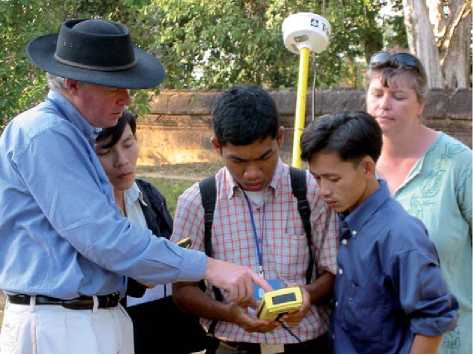
Figure 14 GPS training workshop for staff of the APSARA authority, Cambodia. Management authorities and local communities in developing countries are becoming increasingly involved in site mapping and the application of participatory GIS methods.
The power of modern instruments tempts us to record an excessive level of accuracy and/or detail, simply because we can. This can lead to unnecessary expense and may obscure the real aims of the exercise.
In general it is more important to record the relative location of adjacent features than the absolute position of features across a large site. A clear distinction must therefore be made between mapping ‘precision’ (small-scale detail, often required to the centimeter) and mapping ‘accuracy’ (absolute positioning of features, rarely required to better than a meter). Site mapping will generally require operations at two different scales, most often applying different techniques.
A good review of survey and mapping techniques for archaeological sites can be found in Napton and Greathouse (1997). They also reference ‘classic’ site mapping exercises.
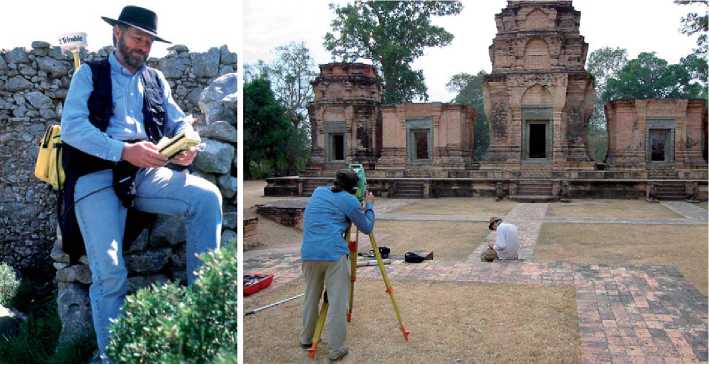
Figure 15 Left, backpack DGPS being used to survey abandoned agricultural features on the island of Kythera, Greece. Right, precise local survey of a small temple site at Angkor, Cambodia using a Total Station. Reflectorless measurements and remotely controlled auto-tracking instruments allow survey by a single operator.
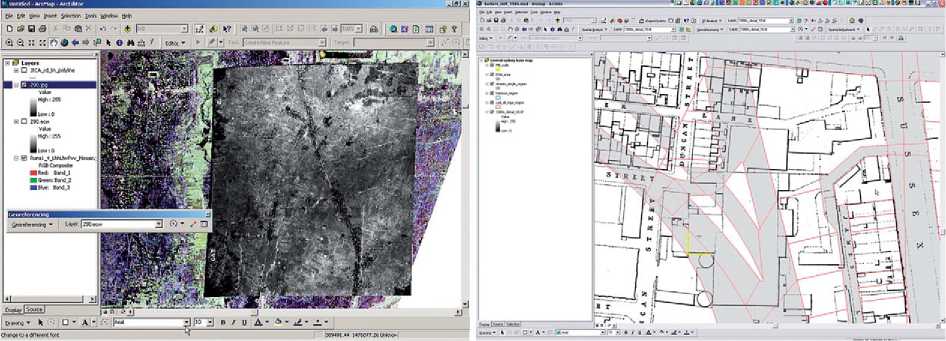
Figure 16 Left, digitization of archaeological features from AirSAR airborne radar imagery; Angkor, Cambodia. The imagery is georeferenced and overlaid with modern landscape features. Right, georeferencing and rubbersheeting an historic map to modern coordinates using cadastral data as reference; Barkers Mill Site, Sydney.
General Survey
The first step in studying a site is normally a general survey to map the overall context of the site, record the surface topography, establish a datum and grid system, establish control points for integration of scanned aerial images and maps, and map the location of major contemporary and exposed archaeological features - cliffs, terraces, gulleys, roads, buildings, cisterns, vegetation, boulders, rockshelter walls, etc. (Figure 3).
As late as the 1980s, initial site survey was carried out somewhat laboriously with compass and tape, or with plane table, alidade, dumpy level, and graduated staffs, often necessitating the establishment of multiple survey stations and considerable skill in surveying practice. Today, the widespread availability of Total Stations and GPS receivers, means that many sites can be rapidly surveyed from a single survey station or by using a GPS (Figure 14) to follow (‘occupy’) the outlines of features on the ground. The results are stored within the instrument or an attached data logger and can be uploaded directly to surveying, CAD or GIS software (Figure 13).
After a framework has been established, the survey may pull in information such as existing topographic or street mapping, satellite imagery, airborne sensor data, and aerial photography (Figure 16). For urban areas and development sites large scale maps are often available in digital form (often as CAD drawings). Some major projects may commission aerial photography and the application of photogrammetry, as was done for the Teotihuaciin map. Smaller sites and sites in isolated areas may simply be surveyed on the ground from scratch. Historical maps may also be added to the site map (Figures 9 and 16) to provide information on features which are no longer visible or the use of abandoned features, or to reveal the tapho-nomic history of the site, such as changed river courses or quarrying. Finally the survey may call for geophysical methods (resistivity, magnetometry, or ground penetrating radar) to locate buried features such as trenches, graves, or kilns.
Heads-up digitizing of features from scanned maps and imagery, allows rapid generation of general site maps with a very small amount of on-the-ground work. The map of Angkor (Figure 1) shows thousands of features mapped from air photographs and AIR-SAR radar imagery, many of which are undetectable on the ground and/or cannot be visited due to physical conditions. Aerial photography has been widely used, particularly in the UK, where exposed structures, soil and crop marks, surface topography, and other evidence of buried features have been mapped by English Heritage over more than 30% of the country to systematic standards and accuracies in the range 2-10 m. These techniques are covered in more detail in the entry on Remote Sensing (see Remote Sensing Approaches: Aerial; Geophysical).
The development of powerful Desktop Mapping and GIS on desktop PCs provides an excellent tool for integration of these many sources of information in a single, seamless database with a common coordinate system. Since this coordinate system can be tied to locations on-the-ground through survey or GPS navigation, the site database can be used to target fieldwork - including detailed surveying, surface sampling, and excavation - in relation to identified features, even if they no longer show up on the surface. The availability of GIS, CAD, and survey software, combined with the ease of use and falling cost of GPS and digital survey equipment, has more or less removed the need for a trained surveyor on most projects.
Local Mapping
Having established the overall framework of the site, detailed localized mapping will generally be required for exposed features and/or as part of the excavation process.
Local mapping may be carried out either with a Total Station - a well-developed example is McPherron and Dibble 2002 - or using manual measuring and drawing methods - Barker 1993 provides a comprehensive account. Manual methods include the use of a drawing frame to subdivide grid squares for rapid but accurate sketching (Figure 17), and measurements made relative to trench walls, grid squares actualized with pegs or hanging plumblines, or within a local grid centered on a survey point (used particularly to sample scattered features across large open sites). Local maps are generally drawn on special map forms or squared paper (Figure 5), while ancillary data such as artifact coordinates and descriptions are entered on related forms or in field notebooks. Portable data loggers may also be used, allowing rapid integration of results into a master site database. Some sites use bar coding to efficiently relate collected material to the mapping data.
More automated methods of generating detailed local plans at the trench or grid square level have also been used. These include the use of low-level vertical photography from a monopod, bipod, tripod, or gantry (Figure 17) - used to print local plans which can be annotated in the field - and various forms of pantograph or video-based tracing systems. Some projects have also applied low-cost methods of aerial photography such as balloons, kites, and model planes. The widespread availability of digital cameras and software developments promise to streamline these methods of local plan production.
The end product of local plan production, particularly on deeply stratified excavations, is large numbers of overlapping plans which must be merged into usable composite documents. For extensive single context sites, such as surface artifact scatters or rapidly sealed ‘living floors’, this is generally a straightforward process, easily achieved within a GIS or CAD package. For stratified and complex excavations, a great deal of manual work will be required, perhaps assisted by CAD software, in order to build a series of maps tied to stratigraphic records representing the phases of the site (Figure 6). GIS packages are less suitable as they cannot generally represent a 3D volume. Object-oriented GIS perhaps hold more promise, but as yet these systems are insufficiently developed. Some excavations have experimented with the use of true volumetric (voxel-based) software, developed for the mining industry, but no excavation has relied on this technology as a core system.
Coordinate Reference Systems
Horizontal coordinate system Maps for smaller sites are normally prepared relative to a local site datum. With the increasing availability and use of GPS and GIS for site mapping, we can expect most new projects on larger sites to adopt standard map grid references as their basic reference system. In other cases the site coordinate system may or may not be aligned to true north. Often the axes will be oriented for convenience with respect to landscape features, urban plan, cave walls, or magnetic north
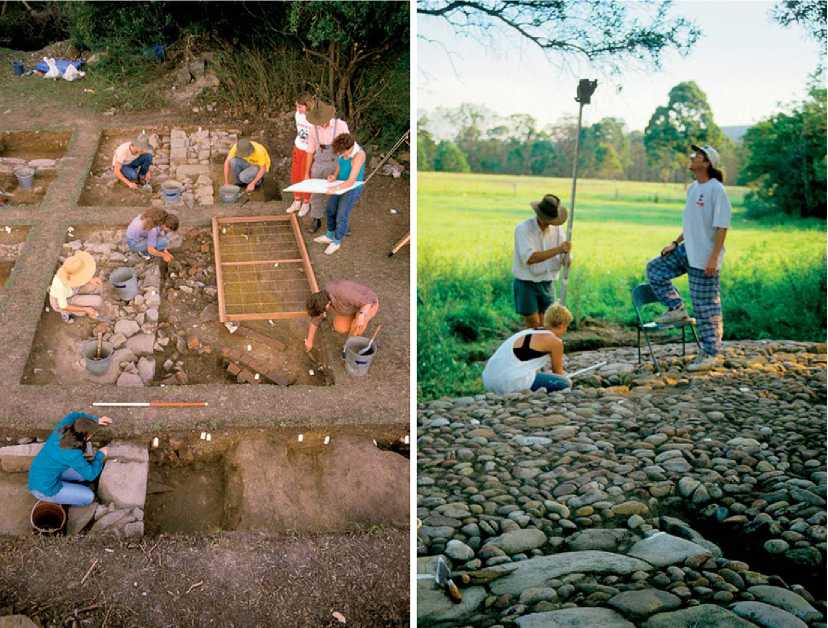
Figure 17 Field methods for creating local plans. Left, a drawing frame in use for manual planning of a trench. Right, low-level vertical photography for detailed mapping of a pebble pavement; Regentville, Sydney.
(which often diverges several degrees from true north). In these cases, the site may be tied to geographic coordinates simply by citing a map reference and elevation, and by indicating north on the site map. In other cases the site datum may be accurately surveyed with respect to official benchmarks and in rare cases the data may be transformed to geographic coordinates.
Site grid For practical recording during fieldwork, people generally require a convenient reference grid which allows fieldworkers to describe locations and carry out local detailed mapping without the need to reference long numerical geographic coordinates. In the past, grids on British - and US-run excavations were often in units of 5 or 10 ft, but today metric grids have been widely adopted. Grids on large sites will often be laid out as quadrats of 100 m, 500 m, 1000 m, or even more, which are then subdivided. Combinations of letters and numbers are often used to describe grid locations, which may also be used as sampling units.
Elevations Site maps will often indicate the elevation of surfaces either through spot heights (routinely used in localized recording) or contours (used to indicate the general lie of the original surface or the interface between horizontally extensive contexts). Contour lines in the past were generated either by following and mapping contours in the field, by measuring a grid of regularly spaced spot heights and interpolating between them or by photogrammetry from stereo aerial photographs. Today they are generated with ease from regular or haphazard distributions of spot height measurements, using GIS. The accuracy of these procedures is rarely reported. For larger sites, digital elevation models (DEM) - a regular grid of elevation values - are often available from mapping authorities. DEM for the entire globe, as well as more detailed coverage of particular areas, have been obtained through radar interferometry from aerial sensors and satellites flown by agencies such as NASA.
Unlike conventional maps, excavation site maps often record depths below the site datum rather than elevation above a datum. This strangely counterintuitive practice reflects the fact that excavators measure downwards from a datum level established by an optical instrument, horizontal string or water level, and do not a priori know how far down deposits will extend.
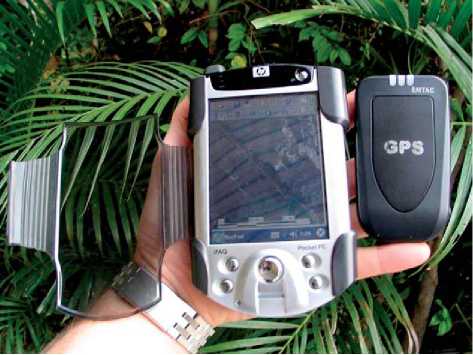
Figure 18 A PDA wirelessly connected to a Bluetooth GPS receiver provides a compact, mobile navigation and data logging system for large sites. The PDA runs a stripped-down GIS program (ArcMap) which shows location on a map display and records field notes and attributes with attached location for later download to a site database. Digital camera photographs can also be located by matching their timestamps with the GPS tracklog.
Data Loggers and Mobile Computing
Discussions of mobile computing - GPS, handheld computers, data loggers, wireless connectivity - emphasize efficiency gains, but do not generally consider the implications of these devices for the way archaeology is practiced, due to changes in what data is collected and how it is interpreted. For example, use of data loggers and digital cameras may lead to more in-field data recording rather than artifact collection and laboratory analysis. Recent work by Simon Holdaway in western New South Wales, for example, has exploited the speed of a Total Station to individually piece-plot artifacts in relation to topography across the landscape, rather than apply gridded collection, allowing more detailed distributional and taphonomic study. The ability to navigate easily and accurately to sampling locations using GPS and to record actual survey and collection tracks, encourages more sophisticated sampling strategies and more precise recording (Figure 18).
Special Site Types/Mapping Difficult Sites
Certain types of site present particular problems and are beyond the scope of this entry. Cave sites often present difficulties through restricted access, limited space and convoluted topography involving the third dimension. Underwater sites present problems of harsh and/or awkward working conditions which limit the range of applicable instruments, restrict time on-site, and limit visibility. Extreme heat and cold can cause problems for humans and instruments alike. Excavations within development sites can pose particular hazards and require rapid recording within a narrow window of opportunity.


 World History


