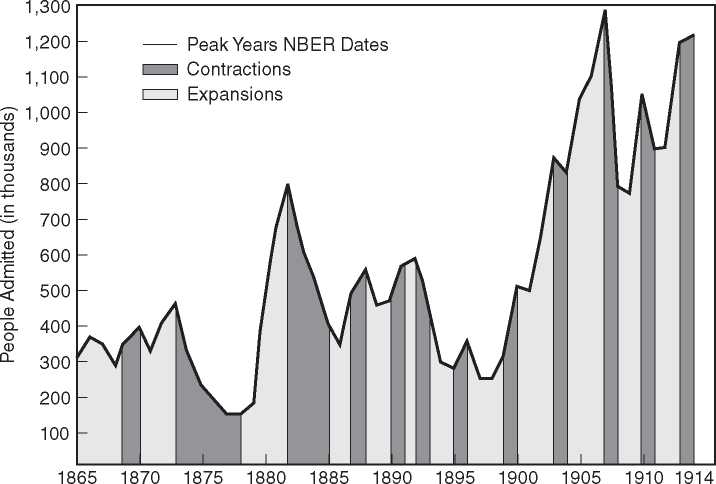
Figure 18.1 traces the arrivals of immigrants in the context of economic fluctuations. Major waves began in the early 1880s and late 1890s. Between 1880 and 1920, more than 23 million immigrants came to make their homes in the United States. Their impact on labor markets was substantial. In 1920, immigrants accounted for 33 percent of railroad laborers, 22 percent of railroad foremen, 33 percent of jewelers and watchmakers, and 17 percent of policemen. More generally, immigrants accounted for 25 percent of the labor force in manufacturing, 35 percent in mining, 18 percent in transportation, and substantial shares in most other sectors (Niemi 1980, 262).
As shown in Figure 18.1, the number of immigrants rose in economic expansions and fell in contractions. Immigrants seemed to be well informed about conditions in
FIGURE 18.1
U. S. Immigration and Business Cycles, 1865-1914

Source: Derived from Historical Statistics I960, Series C88; business cycle dates from Burns and Mitchell 1947, 78.
Year
U. S. labor markets and timed their moves to avoid prolonged periods of unemployment. Often, as Brinley Thomas (1954) showed, periods of economic expansion in the United States were matched by periods of contraction in Europe, increasing the incentive to move. Peak years of inflow coincided with or immediately preceded the onset of severe depressions. This was even true of Russian Jewish immigrants, although in their case persecution (the pogroms) also played an important role (Kuznets 1975; Boustan 2007). Immigration declined greatly during the World War I years as shipping lanes were cut and people went about sterner business.1


 World History


